
Introduction: Why Performance Metrics Matter More Than Ever
The global energy storage market is experiencing unprecedented growth, for small and medium-sized enterprises and commercial operators, understanding how to calculate and evaluate performance indicators of energy storage system can mean the difference between a profitable investment and a costly mistake.
Whether you’re a facility manager evaluating your first storage system or an experienced operator optimizing an existing asset, this guide will walk you through the essential metrics, calculation methods, and evaluation frameworks you need to make informed decisions.
1: The Fundamental Performance Metrics
1: What 5kWh, 10kWh, and 15kWh Actually Mean
1.1 Energy Capacity and Power Capacity
Energy Capacity (kWh/MWh): The total amount of energy the system can store. For lithium-ion systems, this is typically measured at the point of connection (AC side).
Power Capacity (kW/MW): The maximum rate at which the system can charge or discharge.
The Critical Relationship:
Discharge Duration (hours)=Energy Capacity (KWh)/Power Capacity (KW)
A 50KW/100KWh system provides 2 hours of discharge at rated power—classified as short-duration energy storage, suitable for frequency regulation.
C-Rate Explained: The C-rate describes the relationship between power and energy:
– 1C = Full discharge in 1 hour
– 0.5C = Full discharge in 2 hours
– 0.25C = Full discharge in 4 hours
1.2 Depth of Discharge (DoD)
What It Is: The percentage of total capacity that has been discharged.
The Formula:
DoD=Energy Discharged/Total Capacity×100%
Why It Matters:Higher DoD means more usable capacity but accelerates battery degradation. Most lithium-ion systems are rated for 6,000+ cycles at 80% DoD. Operating at 90% DoD may reduce cycle life by 30-40%.
1.3 State of Charge (SoC) and State of Health (SoH)
State of Charge (SoC): The current charge level of the battery, expressed as a percentage of total capacity. SoC is typically communicated by the Battery Management System (BMS).
State of Health (SoH): The ratio of current usable capacity to rated capacity at beginning of life.
The Formula:
SoH=Current Usable Capacity/Rated Capacity×100%
Industry Standard: Most warranties define end-of-life as SoH dropping below 80%.
2: Degradation and Lifetime Metrics
2.1 Cycle Life
What It Is: The number of complete charge-discharge cycles a battery can perform before its capacity falls below a specified threshold (typically 80% of original capacity).
Key Finding from Recent Research:A 2026 study from Chalmers University found that degradation depends strongly on the SoC operating range:
– FCR-D up (long periods at high SoC): Highest capacity loss
– FCR-N (cycling around mid-range): Moderate cycling degradation
– FCR-D down (low SoC operation): Lowest degradation
Our Recommendation: For small and medium-sized commercial energy storage systems, we recommend operating at 20-80% SoC to balance usable capacity with longevity. This “SoC buffer” can extend cycle life by 40-60% compared to full 0-100% cycling.
2.2 Calendar Life and Degradation Rate
What It Is:Capacity loss over time, regardless of cycling activity. Temperature is the primary accelerator—each 10°C increase above 25°C roughly doubles the degradation rate.
Real-World Context:A typical LFP battery degrades approximately 20% over 10 years under normal operating conditions.
3: Economic Performance Metrics
Return on Investment (ROI) and Payback Period
Simple Payback Formula:
Payback Period(years) = Total System Cost/Annual Savings
Case Study from Recent Research: A study of 606 commercial facilities found a minimum discounted payback period of 4.75 years for lithium-ion batteries participating in demand response programs.
Our 2025 Client Data (European Market):
We analyzed 32small and medium-sized commercial energy storage systems installations across Germany, UK, and Italy. Key findings:
| Market | Avg System Size | Avg Payback | Primary Revenue Source |
|---|---|---|---|
| Germany | 250kW/500kWh | 5.2 years | Peak shaving + arbitrage |
| UK | 180kW/360kWh | 6.8 years | Frequency response |
| Italy | 320kW/640kWh | 4.9 years | Self-consumption + arbitrage |
Key Insight: Demand charge reduction is the fastest path to ROI for most commercial customers.
4: Application-Specific Performance Metrics
Different applications prioritize different metrics. Based on DOE-OE Protocol guidelines:
For Peak Shaving (Energy-Intensive):
– Primary Metrics: Energy capacity, RTE, capacity stability
– Secondary: Response time, ramp rate
For Frequency Regulation (Power-Intensive):
– Primary Metrics: Response time, ramp rate, reference signal tracking
– Secondary: RTE, SoC excursions
For Renewable Self-Consumption:
– Primary Metrics: Energy capacity, RTE, cycle life
– Secondary: Degradation rate, calendar life
5: How to Evaluate and Compare Systems: A Step-by-Step Framework
Step 1: Define Your Application and Priorities
Ask yourself:
– What is the primary use case? (Peak shaving? Arbitrage? Backup power?)
– What is the expected daily cycling pattern?
– What are the local electricity prices and tariff structures?
Step 2: Request Complete Performance Data
Don’t settle for marketing claims. Request:
– System-level RTE (including all auxiliary loads)
– Degradation curves at your expected operating DoD and temperature
– Warranty terms including RTE guarantees
– Third-party test results (IEC 62933 series compliance is increasingly important)
Step 3: Calculate Total Cost of Ownership (TCO)
TCO = Capex + (Opex×Years) + (Replacement Costs) – (Energy Savings + Revenue)
INFOGRAPHIC: Energy Storage Technologies Comparison
(Recommended visual: A side-by-side comparison chart)
| Metric | Lithium-Ion (LFP) | Lithium-Ion (NMC) | Lead-Acid | Vanadium Flow |
|---|---|---|---|---|
| RTE | 83-90% | 85-92% | 70-85% | 70-75% |
| Cycle Life | 6,000+ | 2,000-4,000 | 300-3,000 | 15,000+ |
| Energy Density | High | Very High | Low | Low |
| DoD Recommended | 80-90% | 80% | 50% | 100% |
| Response Time | Milliseconds | Milliseconds | Milliseconds | Milliseconds |
| Degradation | Moderate | Moderate-High | High | Low |
| Safety | Very Good | Good | Good | Excellent |
| Best For | All-round | High energy density | Low cost | Long duration |
6: Common Pitfalls and How to Avoid Them
Pitfall 1: Confusing DC and AC Efficiency
The Issue: Manufacturers often quote DC-side RTE (battery cells only), which can be 5-10 percentage points higher than AC-side RTE (including inverters and transformers).
The Fix: Always ask for system-level AC RTE measured at the point of connection.
Pitfall 2: Ignoring Auxiliary Loads
The Issue: HVAC, BMS, lighting, and communications can consume 3-8% of stored energy.
The Fix: Request RTE data that includes all auxiliary power consumption.
Pitfall 3: Overestimating Usable Capacity
The Issue: Rated capacity ≠ usable capacity. DoD limits and SoC buffers reduce usable energy.
The Fix: Calculate usable capacity = Rated Capacity × Maximum DoD × (1 – SoC buffer).
Pitfall 4: Neglecting Temperature Impact
The Issue: Performance degrades significantly outside operating range.
The Fix: Request performance data at your expected operating temperatures.
Conclusion: Making Smart Storage Decisions
Evaluating performance of energy storage system is both a science and an art. The science comes from understanding the metrics, formulas, and industry standards we’ve covered. The art comes from applying this knowledge to your specific application, local market conditions, and business objectives.
The energy storage market is evolving rapidly. With costs continuing to fall and performance continuing to improve, there has never been a better time to invest. But as with any investment, due diligence is essential. Use the framework in this guide to evaluate your options, ask the right questions, and make a decision that delivers real value for your business.
Have questions about evaluating energy storage performance for your specific application? Contact LIPEP team for a free consultation.
Send Your inquiry
We will get in touch in 2 business day.
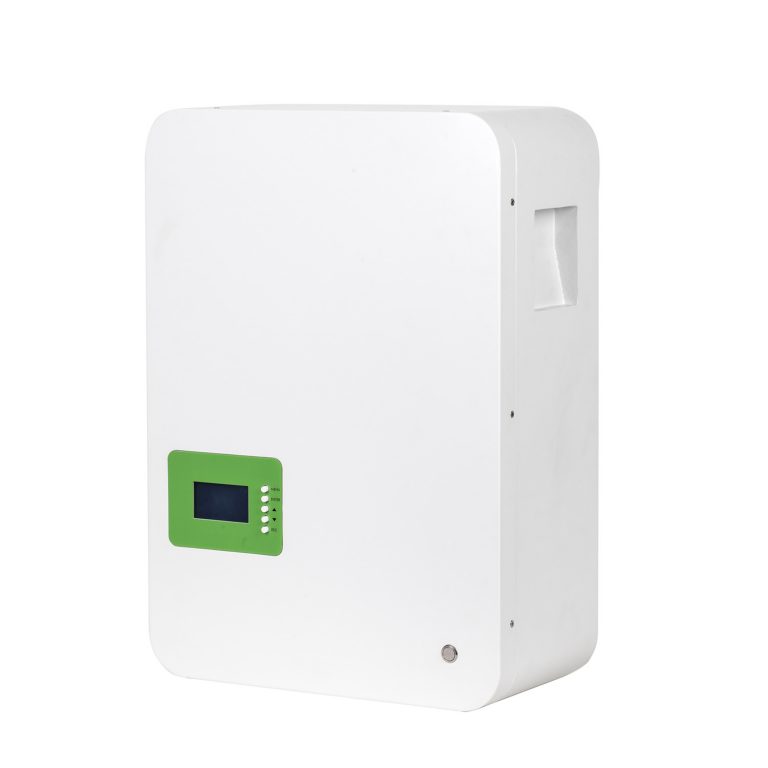
Top Qualtiy 5kwh 48V100ah Home Solar Energy Power System Wall Mounted Battery
LIPEP SERVICES
Customised Service
LIPEP has a wealth of experience and our technical team can provide you with a customised energy storage and solar system tailored to your needs.
Stable & Quick Supply
We have in-depth cooperation with manufacturers and can provide you with quality products quickly.
After-sales Service
We patiently listen to customers' needs and provide one-stop service from consultation, design to implementation and after-sales service.