
Introduction
If you run a factory, warehouse, or logistics facility, the question is no longer whether commercial solar “works” – it is how it works for your specific load profile, roof, tariff, and grid connection. This guide walks through the full chain, from photons hitting a module to kilowatt-hours displacing your most expensive grid electricity. Along the way, we share real 2026 project data, compare module technologies, and map the local policy differences that determine whether a project pays back in 3 years or 7.
Quick answer: A commercial PV system converts sunlight into DC electricity at the module level, an inverter converts that DC into grid-compatible AC, and the facility consumes that power on-site – or exports it, stores it, or both, depending on the system architecture and tariff design.
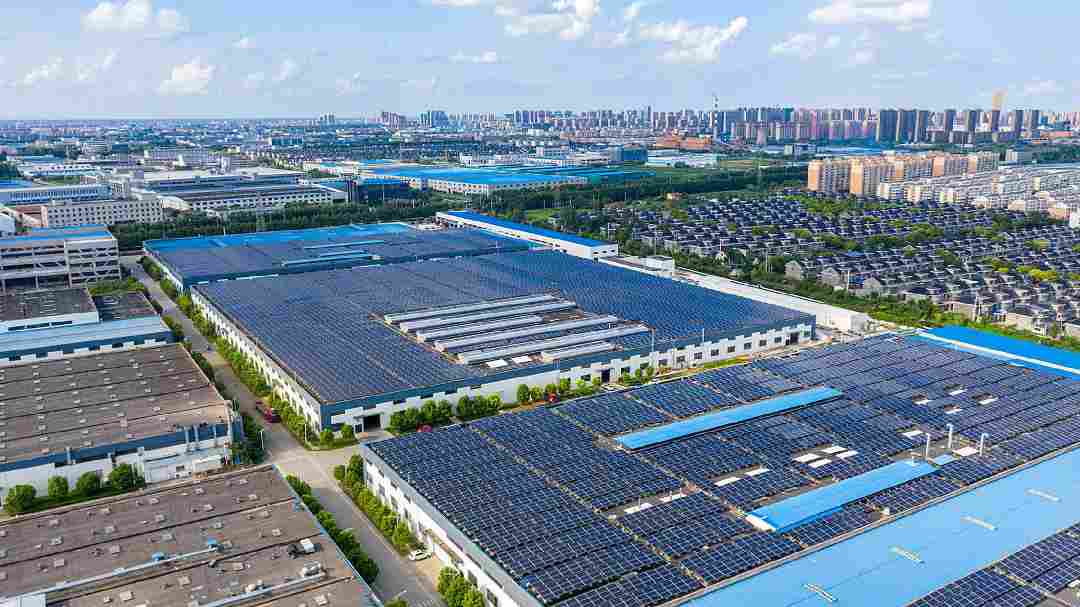
1 - The Core Physics: How Sunlight Becomes Factory Power
Step 1: Photovoltaic effect at the module
When sunlight strikes a silicon solar cell, photons excite electrons across a semiconductor junction, producing direct current (DC) electricity. In 2026, the dominant commercial module technologies are monocrystalline N-type TOPCon (typical module efficiency 21.5–22.8%) and HJT (21.5–22.5%), with older Mono PERC at 20–21.8% and polycrystalline largely phased out of the C&I segment at 15–18%.
Step 2: DC to AC conversion
The DC output from strings of modules flows to an inverter. String inverters dominate the 100–500 kW C&I range because they offer multiple MPPT channels, easier maintenance, and granular monitoring; central inverters become cost-effective above roughly 1 MW on uniform roofs. The inverter synchronises the AC output with the grid and performs anti-islanding protection – it stops feeding power during an outage to protect utility workers and connected equipment.
Step 3: Point of consumption, storage, or export
Generated AC power first serves on-site loads. Surplus electricity can be (a) exported to the grid under a feed-in tariff or export contract, (b) stored in a battery energy storage system (BESS) for later use, or (c) curtailed in markets with export limits. For most C&I projects, the design target is 70–85% self-consumption – the share of generation consumed on-site – because self-consumed kWh are worth the full retail tariff, while exported kWh are worth a lower export rate.
Step 4: Monitoring and control
Modern C&I systems include string-level or inverter-level monitoring with SCADA integration. Alerts for underperformance, soiling, tripped inverters, or string disconnections allow O&M teams to act before yield losses compound.
2 - The C&I System Is Not a Bigger Residential System
This is the most common design error. A 10 kWp home system and a 500 kWp factory system differ not just in scale but in electrical architecture, permitting, and financial structure. A residential connection takes 2–6 weeks; a commercial medium-voltage connection in Germany or Italy can take 12–18 months. C&I systems use three-phase 400V output (or MV for larger projects), ballasted flat-roof mounting without roof penetrations.
3 - What the Numbers Actually Look Like: Case Studies
Case Study – Italian metalworking factory: 1.2-year payback with high-efficiency modules
A metal treatment and coating company in Italy installed a 97.76 kW rooftop system using 208 high-efficiency N-type ABC modules. First-year generation: ~107,500 kWh. Annual electricity bill reduction: more than 40%. The project accessed an energy community incentive that reduced the investment cost by 40%. Result: a 1.2-year payback and an LCOE of approximately €0.03/kWh – well below grid supply costs. On the same roof area, the high-efficiency modules delivered 4.5% more installed capacity and 8.6% more first-year production than conventional TOPCon would have.
Insight for your readers: The 1.2-year figure is exceptional and incentive-driven, but the structural lesson is replicable: on space-constrained industrial roofs, module efficiency is not a “nice-to-have” – it directly determines how many kWp you can fit and therefore how much bill you can displace.
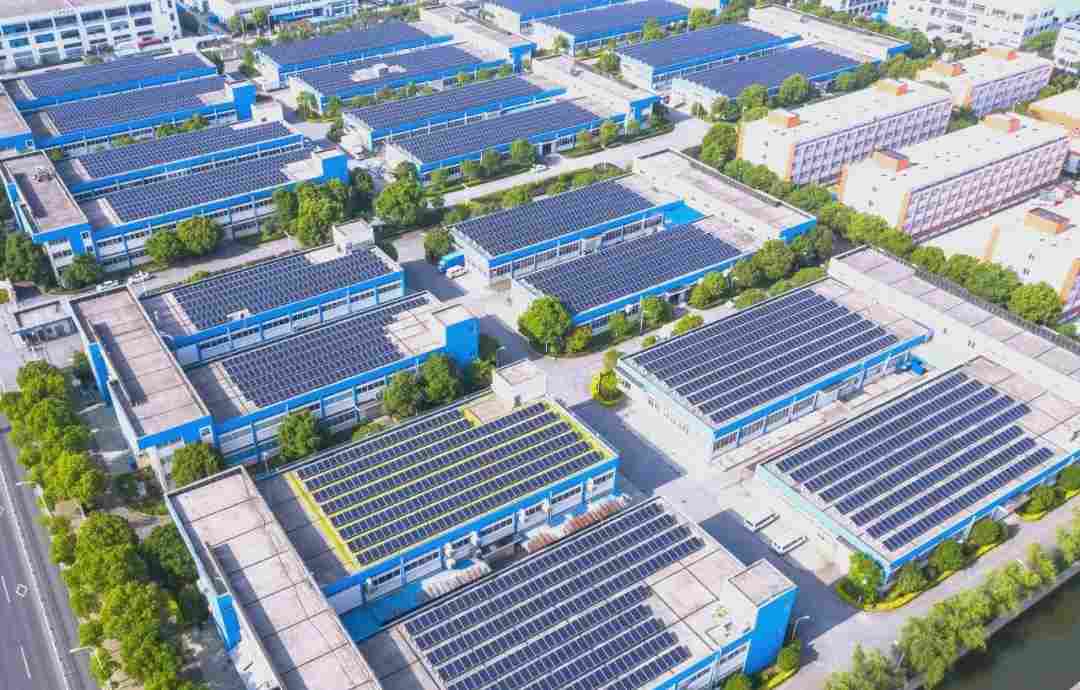
4 - Localisation Matters: Policy Drives the Payback Math
The physics of a solar module is the same in Birmingham and Bavaria. The economics are not.
United Kingdom (2026): tax-led, not grant-led
The old Feed-in Tariff closed to new applicants in 2019. In 2026, there is no UK-wide commercial solar cash grant and no 0% VAT for business installations. What actually exists is a set of permanent tax reliefs and export income:
– Annual Investment Allowance (AIA): 100% first-year tax deduction on qualifying solar spend up to £1m. For a 100 kW system costing £100,000 ex-VAT, the AIA deduction saves £25,000 in corporation tax at 25%, bringing the effective net cost to £75,000.
– Smart Export Guarantee (SEG): fixed-rate export tariffs from major suppliers sit at roughly 4–7p/kWh in 2026, with some dynamic tariffs paying 25–40p/kWh for exported power at peak times.
– Recoverable VAT: commercial solar carries 20% VAT, reclaimable if the business is VAT-registered – always compare quotes ex-VAT.
Typical 2026 UK C&I payback after AIA: 3.5–5 years for well-sized self-consumption projects.
Germany (2026): EEG feed-in tariff + self-consumption premium
Germany’s EEG remains the anchor for commercial solar revenue. For systems commissioned from February 2026:
– Rooftop systems 40–300 kW: EEG feed-in tariff 6.20 ct/kWh, guaranteed for 20 years.
– The real value driver, however, is self-consumption: avoided industrial electricity costs of ~14–16 ct/kWh far exceed the feed-in tariff, so the design priority is maximising on-site use, not export.
– Fraunhofer ISE puts LCOE for large-scale rooftop PV at 5.6–12 ct/kWh – structurally below grid parity for most German C&I loads.
5 - Where Battery Storage Changes the “How”
A solar-only system works when the sun is shining and the factory load is there to absorb it. A PV + BESS system works on a different timescale: it shifts midday generation to evening shifts, to peak-tariff windows, or to demand-charge spikes.
Three value streams drive C&I storage economics in 2026:
- Self-consumption lift: Store surplus midday kWh instead of exporting at a low rate, discharge during production hours or later shifts. This is the primary value stream for most warehouses and factories.
- Demand-charge reduction: In tariffs with a kW demand charge, a short battery discharge during a 15-minute peak can reduce the monthly bill materially. This value stream is strongest for facilities with spiky loads -compressors, chillers, welding, or batch processes.
- Resilience: Paired with islanding-capable controls, BESS can ride through short outages for critical loads.
The economics have shifted: installed battery storage costs fell 93% from 2010 to 2024 (IRENA), and adding storage can compress C&I payback from about 5 years to about 3.5 years in favourable tariff structures. In markets with weak export tariffs or frequent outages, the storage case is stronger; where export rates are high and outages are rare, solar-only may still be the cleaner first move.
6 - What We See on the Ground: A Field Observation from Our Project Pipeline
Original insight – proprietary observation, not a market-average statistic. Across the C&I enquiries our team handled between Q1 and Q3 2026, the single largest driver of underestimated payback was not module price – it was roof structural capacity and grid-connection timeline. Roughly one in three warehouse enquiries that looked financially attractive on a solar-yield basis required either lightweight modules, ballasted racking redesign, or a medium-voltage connection upgrade that added 3–6 months to the timeline. The projects that closed fastest were the ones where the facility team provided 12 months of interval meter data (15-minute resolution) before the site survey. Without interval data, self-consumption modelling defaults to conservative assumptions that either inflate the payback or understate the achievable system size.
What this means for your procurement process: Request interval data first. Ask your installer/EPC to model self-consumption at 15-minute resolution, not monthly totals. The difference between a 65% and an 80% self-consumption assumption on a 500 kWp system can move annual savings by tens of thousands of euros.
7 - A Practical Decision Checklist
Use this checklist as an internal qualification tool before requesting quotes:
– Interval data: 12 months of 15-minute or 30-minute meter data available?
– Roof load capacity: Has a structural engineer confirmed spare load for ballasted racking (typically 20–44 kg/m² installed) or lightweight modules (as low as 3–5 kg/m² module weight)?
– Grid connection: Is the connection LV or MV? Has the DNO/utility study been initiated? (MV can take 12–18 months in some European markets.)
– Self-consumption target: Can daytime load absorb 70–85% of generation, or is BESS needed to lift self-consumption?
– Tariff structure: What is the €/kWh energy rate, and is there a separate kW demand charge?
– Local policy: UK → AIA + SEG. Germany → EEG feed-in + Eigenverbrauch. Other markets → verify current export and tax treatment.
Frequently Asked Questions
How long does a commercial solar installation take?
For a 100–500 kWp rooftop system, physical installation typically takes 2–6 weeks. The longer timeline is pre-construction: structural assessment, permitting, and grid-connection approval can add 2–12 months depending on the market and connection voltage.
Do I need battery storage to make commercial solar work?
No. Solar-only works best when daytime load is high and stable. Storage adds value where export tariffs are low, demand charges are high, or resilience is required. In 2026, BESS is an economic optimisation, not a technical prerequisite for solar.
What is a realistic payback for a C&I solar project in 2026?
Across European markets, self-consumed C&I solar typically delivers 4–7 year paybacks with IRRs frequently above 15%. Exceptionally favourable cases – high tariffs, incentives, or very high self-consumption – have reported paybacks of 1.2–3 years.
Can solar cover 100% of a factory’s electricity?
Rarely from solar alone, because generation peaks at midday while factory loads often peak in the morning or evening. Well-designed systems typically target 50–80% of annual consumption, with storage or grid supply covering the remainder.
Ready to find the right solar+storage solution for your home or business? Contact LIPEP team for a free consultation and customized system design.
Send Your inquiry
We will get in touch in 2 business day.
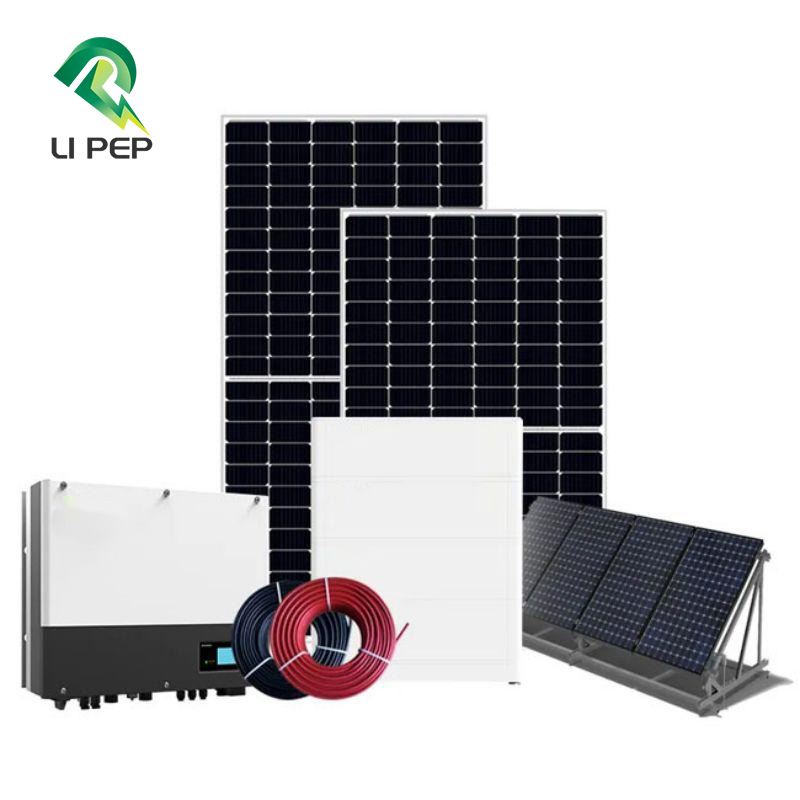
Cutomized 5/8/10kw Solar Power System With High Quality Solar Panel & Storage Battery & Inverter
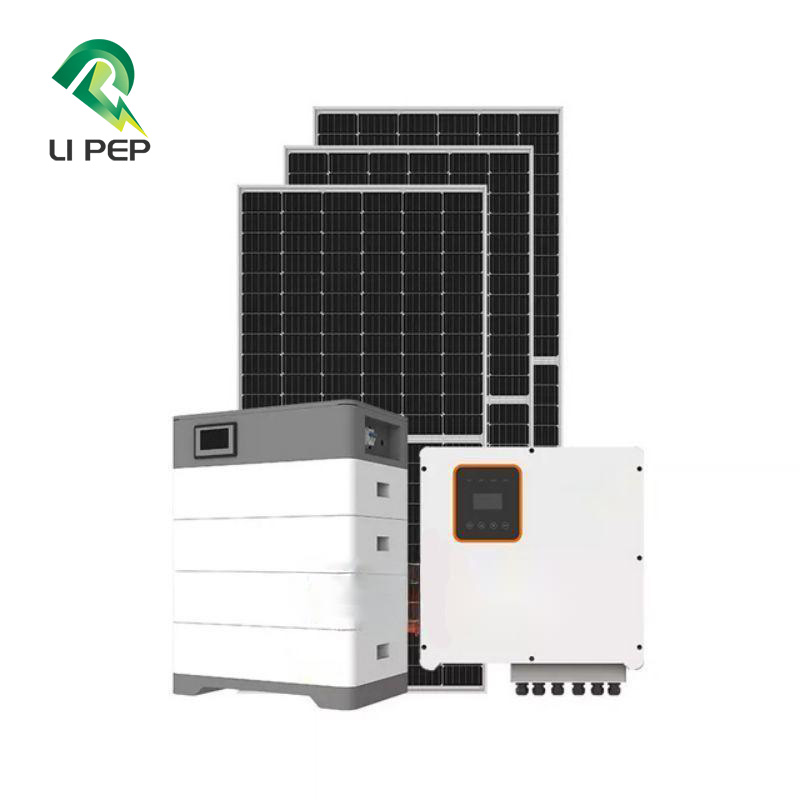
10kw/20kw/30kw Solar Power System With High Quality Solar Panel & Storage Battery & Inverter
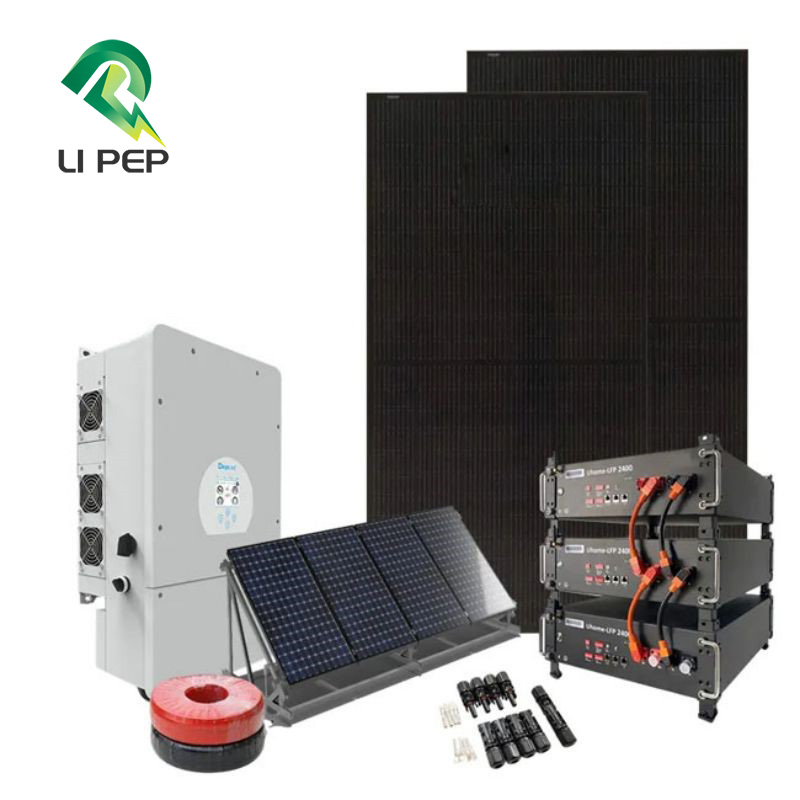
Cutomized 100kw/200kw Solar Power System With High Quality Solar Panel & Energy Storage System
LIPEP SERVICES
Customised Service
LIPEP has a wealth of experience and our technical team can provide you with a customised energy storage and solar system tailored to your needs.
Stable & Quick Supply
We have in-depth cooperation with manufacturers and can provide you with quality products quickly.
After-sales Service
We patiently listen to customers' needs and provide one-stop service from consultation, design to implementation and after-sales service.